AI spreadsheet generator
=SUMIFS(Expenses!E:E,Expenses!D:D,A2,Expenses!A:A,">=2026-10-01",Expenses!A:A,"<2026-11-01")
Describe the table. Download the Excel workbook.
- TestedSame prompt, 5 runs on 7 November 2026 (production build): 5 of 5 delivered a 2-sheet Excel workbook with live formulas (8 to 28 per file, every file opened), median 27 s by Kleap's turn timer. The workbook on this page is an earlier run of the same prompt (6 November 2026, 28 s): 18 live formulas (8 SUMIFS, 8 COUNTIFS and 2 SUM). Times are Kleap's own timer for the AI's turn in our test (one run, or the median where we repeated it), not a promise: yours may take longer, and reading and checking the file comes on top.
- Free to startYour first try usually needs no account; to keep the result, Kleap asks for a free account, with no card. Each file uses Kleap usage, and the free plan's usage refills automatically.
- Using the boxTotals and sums are live formulas; other cells are values. No charts.
What is an AI spreadsheet generator?
An AI spreadsheet generator builds a working spreadsheet from a description. Kleap's AI spreadsheet generator returns an Excel (.xlsx) workbook with named sheets, a header row, sample rows and live formulas, such as SUMIFS totals that recalculate when you type your own rows. It opens in Excel, Google Sheets or LibreOffice. It does not draw charts.
An AI spreadsheet generator builds a workbook from a description of the data you want to track: it chooses the columns, names the sheets and fills in rows. Kleap's AI spreadsheet generator returns an Excel (.xlsx) file with a styled header row, a frozen header, filters on every column and sensible column widths, and up to ten sheets in one file. Totals, sums and averages can be live formulas (SUM, SUMIF, AVERAGE, COUNT, ROUND, IF and a few more), so a summary sheet updates when you change a value on the data sheet. Sample rows are marked as examples; replace them with your own data. It does not draw charts, run macros or connect to live data, and a CSV export keeps values only. Open it in Excel, Google Sheets or LibreOffice, or ask in the chat for another column or sheet. For an invoice built from line items, use the AI invoice generator.
A new workbook, not an assistant inside your file
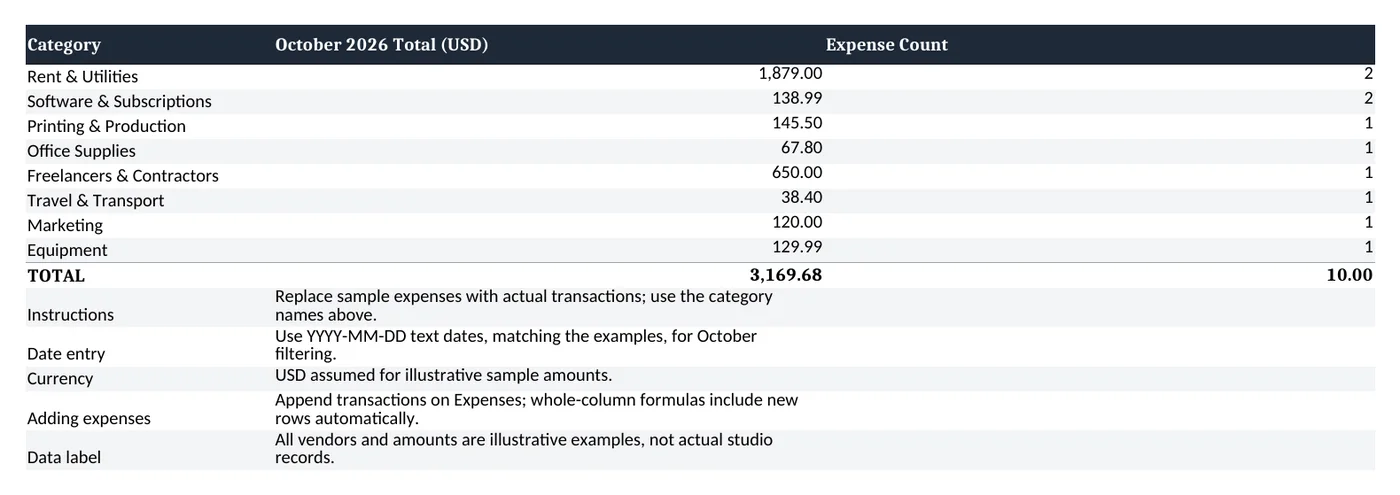
Copilot in Excel and Gemini in Google Sheets work on a workbook you already have open. This page is for the step before: a new file from one sentence. In the workbook on this page, cell B2 of the Summary sheet sums October's Rent & Utilities rows (1,879.00) and cell B10 adds the eight category totals to a TOTAL of 3,169.68 for the 10 sample rows. Type your own rows over the samples and both follow.
When the numbers belong inside a written plan for a lender, use the AI business plan generator for the Word file and keep this workbook for the figures. For a single invoice rather than a tracker, the AI invoice generator returns a PDF.
Checked on 6 November 2026 by the Kleap product team. Test: “Build a monthly expense tracker in Excel (.xlsx) for a design studio. (details on the next line)”, an Excel (.xlsx) workbook, 28 s by Kleap's turn timer.
Measured on
One real run of the prompt in the box above, unchanged: a fresh project, the real Kleap interface, a test account. Every number on this page comes from that run and its delivered file. Times are Kleap's own turn timer, shown under the reply in the chat. One run, not an average.
- Same prompt, 5 runs on 7 November 2026 (production build)
- 5 of 5 delivered a 2-sheet .xlsx with live formulas (8 to 28 each)
- Median of Kleap's turn timer over those runs
- 27 s
- Kleap's turn timer (the workbook on this page, 6 November 2026)
- 28 s
- Sheets
- 2
- Live formulas in this workbook
- 18 (8 SUMIFS, 8 COUNTIFS and 2 SUM)
- Read from this workbook (Summary sheet)
- Rent & Utilities (B2): 1,879.00 · TOTAL (B10): 3,169.68
- Charts
- none
See what this prompt creates
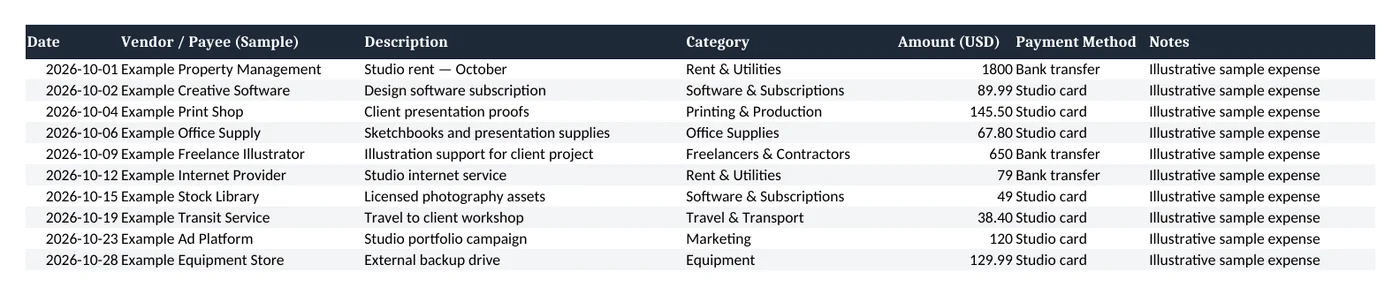
Real output of the prompt in the box above, generated with Kleap on 6 November 2026, rendered from the delivered file. Not a mockup. From the prompt in the box, unchanged, Kleap returned an Excel (.xlsx) workbook in 28 s by Kleap's turn timer, with 2 sheets. Expenses: 10 October 2026 sample rows (date, vendor, description, category, amount in USD, payment method, notes), every vendor named “Example …” and marked “Illustrative sample expense”, with real Excel dates, a filter over the data and a frozen header. Summary: one row per category (8) with a live SUMIFS total and a COUNTIFS count limited to October 2026, then a TOTAL row (3,169.68 for the sample rows, 10 expenses). Type your own rows over the samples and the totals follow when the file opens in Excel or LibreOffice. No charts.
| Cell | Row | Formula |
|---|---|---|
| Summary!B2 | Rent & Utilities, October total | ==SUMIFS(Expenses!E:E,Expenses!D:D,A2,Expenses!A:A,">=2026-10-01",Expenses!A:A,"<2026-11-01") |
| Summary!C2 | Rent & Utilities, October count | ==COUNTIFS(Expenses!D:D,A2,Expenses!A:A,">=2026-10-01",Expenses!A:A,"<2026-11-01") |
What we checked in the delivered file
- 2 sheets (Expenses, Summary) and 18 formulas in the .xlsx, read from xl/worksheets: a SUMIFS and a COUNTIFS per category, then SUM for the TOTAL row.
- Opened in LibreOffice, the Summary computes 3,169.68 for the 10 sample rows; the dates are real Excel dates, so the October filter in the formulas works in Excel too.
- Filters cover the data (Expenses A1:G11, Summary A1:C15) and the header row is frozen on both sheets.
- The 10 rows are sample data: every vendor starts with “Example” and each row is noted “Illustrative sample expense”.
Show the exact prompt
Build a monthly expense tracker in Excel (.xlsx) for a design studio. Details: an Expenses sheet with 10 sample October 2026 expenses; a Summary sheet with live totals by category.
How we tested the AI Spreadsheet Generator, and when to use something else
How this page was tested
- We sent the box prompt as written and opened the .xlsx it returned.
- We listed every formula cell in the file (SUMIFS, COUNTIFS, SUM): the totals are formulas, not typed numbers.
- We checked the filters and the frozen header rows.
Good for
- Trackers and lists with totals that update as you add rows
- A sheet that opens in Excel, Google Sheets or Numbers
- Sample rows to replace with your own
Use something else for
- Charts, pivot tables or macros: the file has none.
- Connecting to your bank or accounting data.
- A one-off invoice: use the AI invoice generator
Tables you can start using right away
Expense and budget trackers
A transaction sheet plus a summary sheet with totals per category.
Content and project calendars
Dates, owners and statuses in a filterable table.
Inventory and price lists
Products, quantities and prices ready to sort and filter.
Gradebooks and attendance sheets
Names and scores for a class, with a scale on a second sheet.
Sample data for testing
Fictional customers, orders or events as .xlsx or CSV.
From description to workbook in three steps
Describe the data
Say what you want to track, which columns you need and how many sample rows to start with.
Kleap builds the workbook
It creates the sheets, styles the header row, sets column widths, fills the rows and writes the totals as formulas.
Download and take over
Save the .xlsx, open it in Excel or Google Sheets, replace the sample rows and watch the totals update.
How Kleap compares
Facts from each tool's own page, read on 9 November 2026 (follow the source link to check). Kleap's row describes what the example above shows.
Which tool for which case
Pick MockFlow when the table should live on a shared whiteboard, or be made from Claude or ChatGPT. Pick RowSpeak when you want to keep analysing the sheet in the same tool, or host it yourself. The third top result is a Reddit thread, not a tool. Pick Kleap when you want one .xlsx file with live common formulas to open in Excel or Google Sheets.
| Tool | What you get | Free path | Best at |
|---|---|---|---|
| Kleap | Excel .xlsx with live SUMIFS, COUNTIFS and SUM totals, filters, frozen header | Your first try usually needs no account; to keep the result, Kleap asks for a free account, with no card. Pro from $25/month (see /pricing). | Workbook, plan and site for the same business in one project |
| Google's US top 3 for “ai spreadsheet generator”, read 9 November 2026 | |||
| MockFlow AI spreadsheet generatorSource, checked 9 Nov 2026 | Spreadsheets and data tables with formulas, on a collaborative whiteboard | Free AI credits; free from Claude or ChatGPT through its MCP server | A new MockFlow board with a shareable URL |
| RowSpeak AI spreadsheet generatorSource, checked 9 Nov 2026 | Business spreadsheets, trackers and formulas from plain-English instructions; download | Try for free | Self-hosted option |
| Category leaders (not in this SERP, read 9 November 2026) | |||
| Google Sheets with GeminiSource, checked 9 Nov 2026 | Describe what you need; Gemini builds or edits spreadsheets with native formulas and pivot tables | Google Workspace product (no price in the lines quoted) | Writes and debugs formulas; dashboards in Sheets canvas |
Start free. Upgrade when you need more.
Your first try usually needs no account; to keep the result, Kleap asks for a free account, with no card. Files and images use your Kleap usage: free usage refills over time, and paid plans add much more.
Free
- Free usage that refills
- Free account to save your results and find them again
Pro
- Much more usage
- Custom domain for your Kleap websites
Start with a filled table and live totals
A new spreadsheet usually starts with ten minutes of deciding on columns and typing sample rows. Kleap does that part: it designs the columns for what you want to track, fills in realistic rows and puts related tables on separate sheets in one workbook.
Totals, sums and averages can be live Excel formulas, so the summary changes when you edit a row. Kleap does not draw charts or write macros: add those in Excel or Google Sheets on top of the table if you need them. To fill a sheet from receipt photos, use the receipt scanner; to log spending from a phone instead of a file, Kleap builds an expense tracker app.
Questions, answered.
How do I generate an Excel spreadsheet with Kleap?
Describe the table in the box at the top of this page and ask for an Excel (.xlsx) file. Kleap builds the workbook and shows the download in the chat.
Does it write Excel formulas?
Yes, for totals and simple calculations. The test workbook on this page has 18 live formulas (8 SUMIFS, 8 COUNTIFS and 2 SUM), reading the Expenses sheet from the Summary sheet, so a total changes when you edit a row. Lookups, links and macros are not written as formulas. Ask for totals in your request, as the example does.
Does it create charts?
No. The workbook holds tables and formulas, not charts. Select the table in Excel or Google Sheets and insert a chart in two clicks.
Can I get more than one sheet?
Yes. Ask for each sheet by name and describe its columns, and they all arrive in one workbook.
Can I get a CSV instead?
Yes. Ask for a CSV and you get a single-table file for importing into another tool.
Is the sample data real?
No. Sample rows are made-up examples to show how the table works. Replace them with your own records.
Can I edit the spreadsheet afterwards?
Yes. Ask in the same chat: Kleap edits the stored workbook (the cells and rows you name; a bigger change such as a new sheet is written again), or edit the downloaded file yourself.
Get the table you describe.
Describe the data and download an Excel workbook or a CSV. Totals stay live formulas in the .xlsx; a CSV keeps values only.
Written by the Kleap product team. Checked on 9 November 2026 against the generated files and runs shown on this page.